
Markets can move fast—sometimes too fast to feel comfortable. Big swings in prices can cause stress even for experienced investors. But while volatility may feel unsettling in the moment, it's a normal part of the investing journey.
Whether you're saving for retirement, growing wealth or protecting what you've built, embracing a long-term mindset and understanding market volatility can help you stay grounded and confidently navigate changing conditions while staying focused on your most important goals.
What is market volatility?
Volatility reflects how much short-term risk investors and volatility traders may face, and it can influence the price of financial products like options. It also can affect investor behavior, sometimes leading to
What causes market volatility?
Stock market volatility often reflects how investors respond to new information, especially when it creates uncertainty. A range of factors, including economic reports, earnings announcements, policy changes and global events, can cause prices to swing more sharply than usual.
Common drivers of market fluctuations include:
- Economic data surprises. Reports on inflation,
GDP growth , consumer spending orunemployment can shift market expectations, particularly if the data is much stronger or weaker than expected. - Corporate earnings and guidance. When companies report quarterly results that fall short of expectations or change their future outlook, stock prices can shift.
- Geopolitical events and policy shifts. Trade tensions, elections, interest rate changes or international conflicts can bring uncertainty that leads to market swings. For example, Russia's invasion of Ukraine and central bank rate hikes in 2022 both contributed to global market volatility because investors weren't sure which way these events would turn.
- Algorithmic trading. Computer algorithms can amplify market swings by responding instantly to price movements, especially during a sudden market crash or a fast-moving down market.
Volatility often spikes when markets are factoring new information into price decisions. It can feel chaotic, but it often reflects investors adapting to shifting conditions. It doesn't always mean there will be lasting damage. For recent developments, check out the
How market volatility is measured
Economists and analysts assess market volatility by looking at how much prices fluctuate over a period of time. Understanding how volatility is calculated can help investors get a clearer picture of where uncertainty may be showing up and whether it's based on past behavior or future expectations.
Forward-looking volatility
Forward-looking, or implied, volatility estimates expected future price movement. One of the most widely followed stock market volatility indicators is the
Other asset classes, like bonds, have their own volatility measures based on the same ideas. But across markets, a spike in implied volatility can signal rising concerns about future uncertainty, such as earnings surprises, economic data or geopolitical risk.
Historical volatility
Historical volatility looks at trends across time. It measures how much an asset's price has moved over a set period, commonly using standard deviation.
Another tool is the
Unlike implied volatility, these tools show what's already happened, not what might come next. But watching how volatility trends change over time can help investors spot patterns, know when to rebalance portfolios and avoid overreacting to short-term market swings.
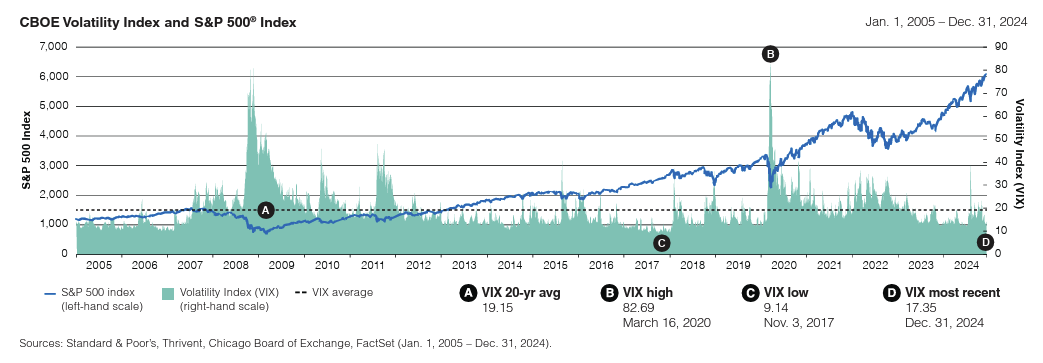
The chart below tracks market volatility from 2005 to 2024.
How standard deviation is calculated
Market volatility is often measured using statistical tools like standard deviation and variance, which can help investors determine how much prices deviate from their average. This offers a gauge of how bumpy a particular investment might be over time.
To illustrate with an example, let's say a stock has monthly returns of +2%, +4%, +6%, +8% and +10%. To calculate the variance and standard deviation, you'd do the following steps:
- Find the average of these returns, which is 6%.
- Calculate how far each return is from the average. This is the deviation. With these numbers, 2%-6% = -4%, 4%-6% = -2%, 6%-6% = 0%, 8%-6% = 2% and 10%-6% = 4%.
- Square each of those differences: -42=16, -22=4, 02=0, 22=4, and 42=16.
- Add the results together (in this case, 40), then average them to get the variance, which is 8 in this example.
- Take the square root of the variance to get the standard deviation.
In this example, the standard deviation is 2.83%, which means the stock's returns typically move about 2.83 percentage points above or below the average return in a given month.
The higher the number, the more the stock's performance bounces around, making it harder to predict. A lower number can suggest more consistent, stable returns over time.
Volatility investing: Opportunities & risks
Many investors try to avoid big market swings. But some traders look at volatility as a potential opportunity. Volatility trading focuses on making trades that profit when market volatility increases or decreases regardless of whether the market rises or falls.
This approach uses specialized tools like VIX futures or options designed to gain or lose value based on how much the market moves, not which direction it moves in.
Common volatility trading instruments
These are some of the most widely used tools for managing volatility:
- VIX futures. These contracts let traders speculate on or hedge against changes in expected market volatility, based on the Cboe Volatility Index, which tracks the expected 30-day volatility of the S&P 500.
- Options. These financial contracts give the buyer the right, but not the obligation, to buy (call) or sell (put) an asset at a specific price.
- Exchange-traded products (ETPs). Some exchange-traded funds (ETFs) and exchange-traded notes (ETNs) are designed to track volatility indexes like the VIX, though these can be very complex. Note: Both
FINRA and theSEC have issued warnings about the unique investing risks associated with ETPs and ETNs.
These tools and strategies can play a role for experienced traders. However, investors may be better served by focusing on long-term goals, maintaining a balanced portfolio and staying grounded during market swings.
Missing just a handful of the market's top-performing days can significantly reduce your overall returns. For instance, over a 20-year period, being out of the market during the 10 best days could slash your total return by half. While pulling your money out may help you avoid short-term losses, it also increases the risk of missing the recovery. Historically, some of the strongest gains have occurred shortly after major downturns—so trying to time the market could end up doing more harm than good.

When market swings start making headlines, it can be tempting to act fast, especially when uncertainty is on the rise. But emotional decisions can do more harm than good.
How can you protect your investments in a volatile market?
These six strategies can help you stay grounded and make steady progress even when the
1. Diversify your portfolio
2. Invest consistently with dollar-cost averaging
Rather than trying to guess when to buy,
3. Rebalance regularly
Over time, market performance can shift the mix of your investments.
4. Build and maintain an emergency fund
Having savings set aside in an
5. Reassess your risk tolerance
Volatility can be a useful moment to evaluate how comfortable you are with market ups and downs. If recent swings have caused you stress, consider adjusting your investment strategy to better reflect your
6. Avoid emotional decisions
It's natural to feel nervous during a stock market decline. But reacting impulsively, like pulling out at the bottom, can lock in losses and derail long-term plans.
The best way to prepare for market volatility is not to be surprised by it. Have a conversation with your financial advisor and be sure you understand how your current financial strategy is positioned to meet your long-term goals.
The market may be uncertain, but your financial plan doesn't have to be
Volatility is part of investing. But with the right strategy, it doesn't have to shake your confidence in long-sighted moves toward achieving your financial goals. If you're unsure how to move forward, a